
MatchLogger: The app continues
A web app for analytically visualizing soccer player movements and touches, prototyped with HTML, CSS, JavaScript, and Python.

Youth soccer: Stay in position! An updated app.
A web app to track and visualize player movements, prototyped with HTML, CSS, JavaScript, and Python. And now improved.

Youth soccer: Stay in position!
A web app to track and visualize player movements, prototyped with HTML, CSS, JavaScript, and Python.

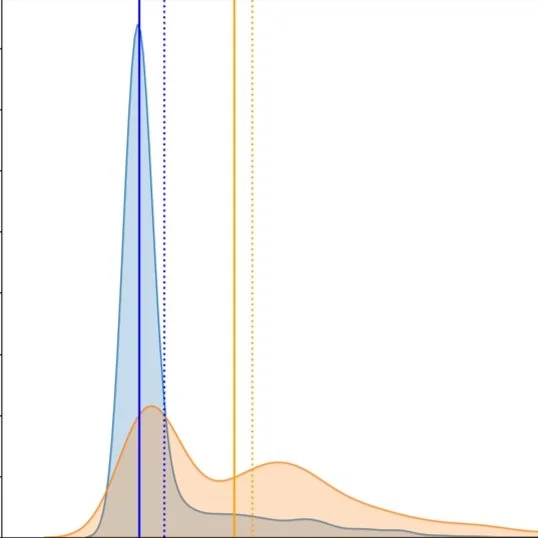
Funny distributions: Professional soccer player size, footedness, and birthdays
Using athlete data to trial workflows and how/when to use Python or SQL or QGIS… or ChatGPT.
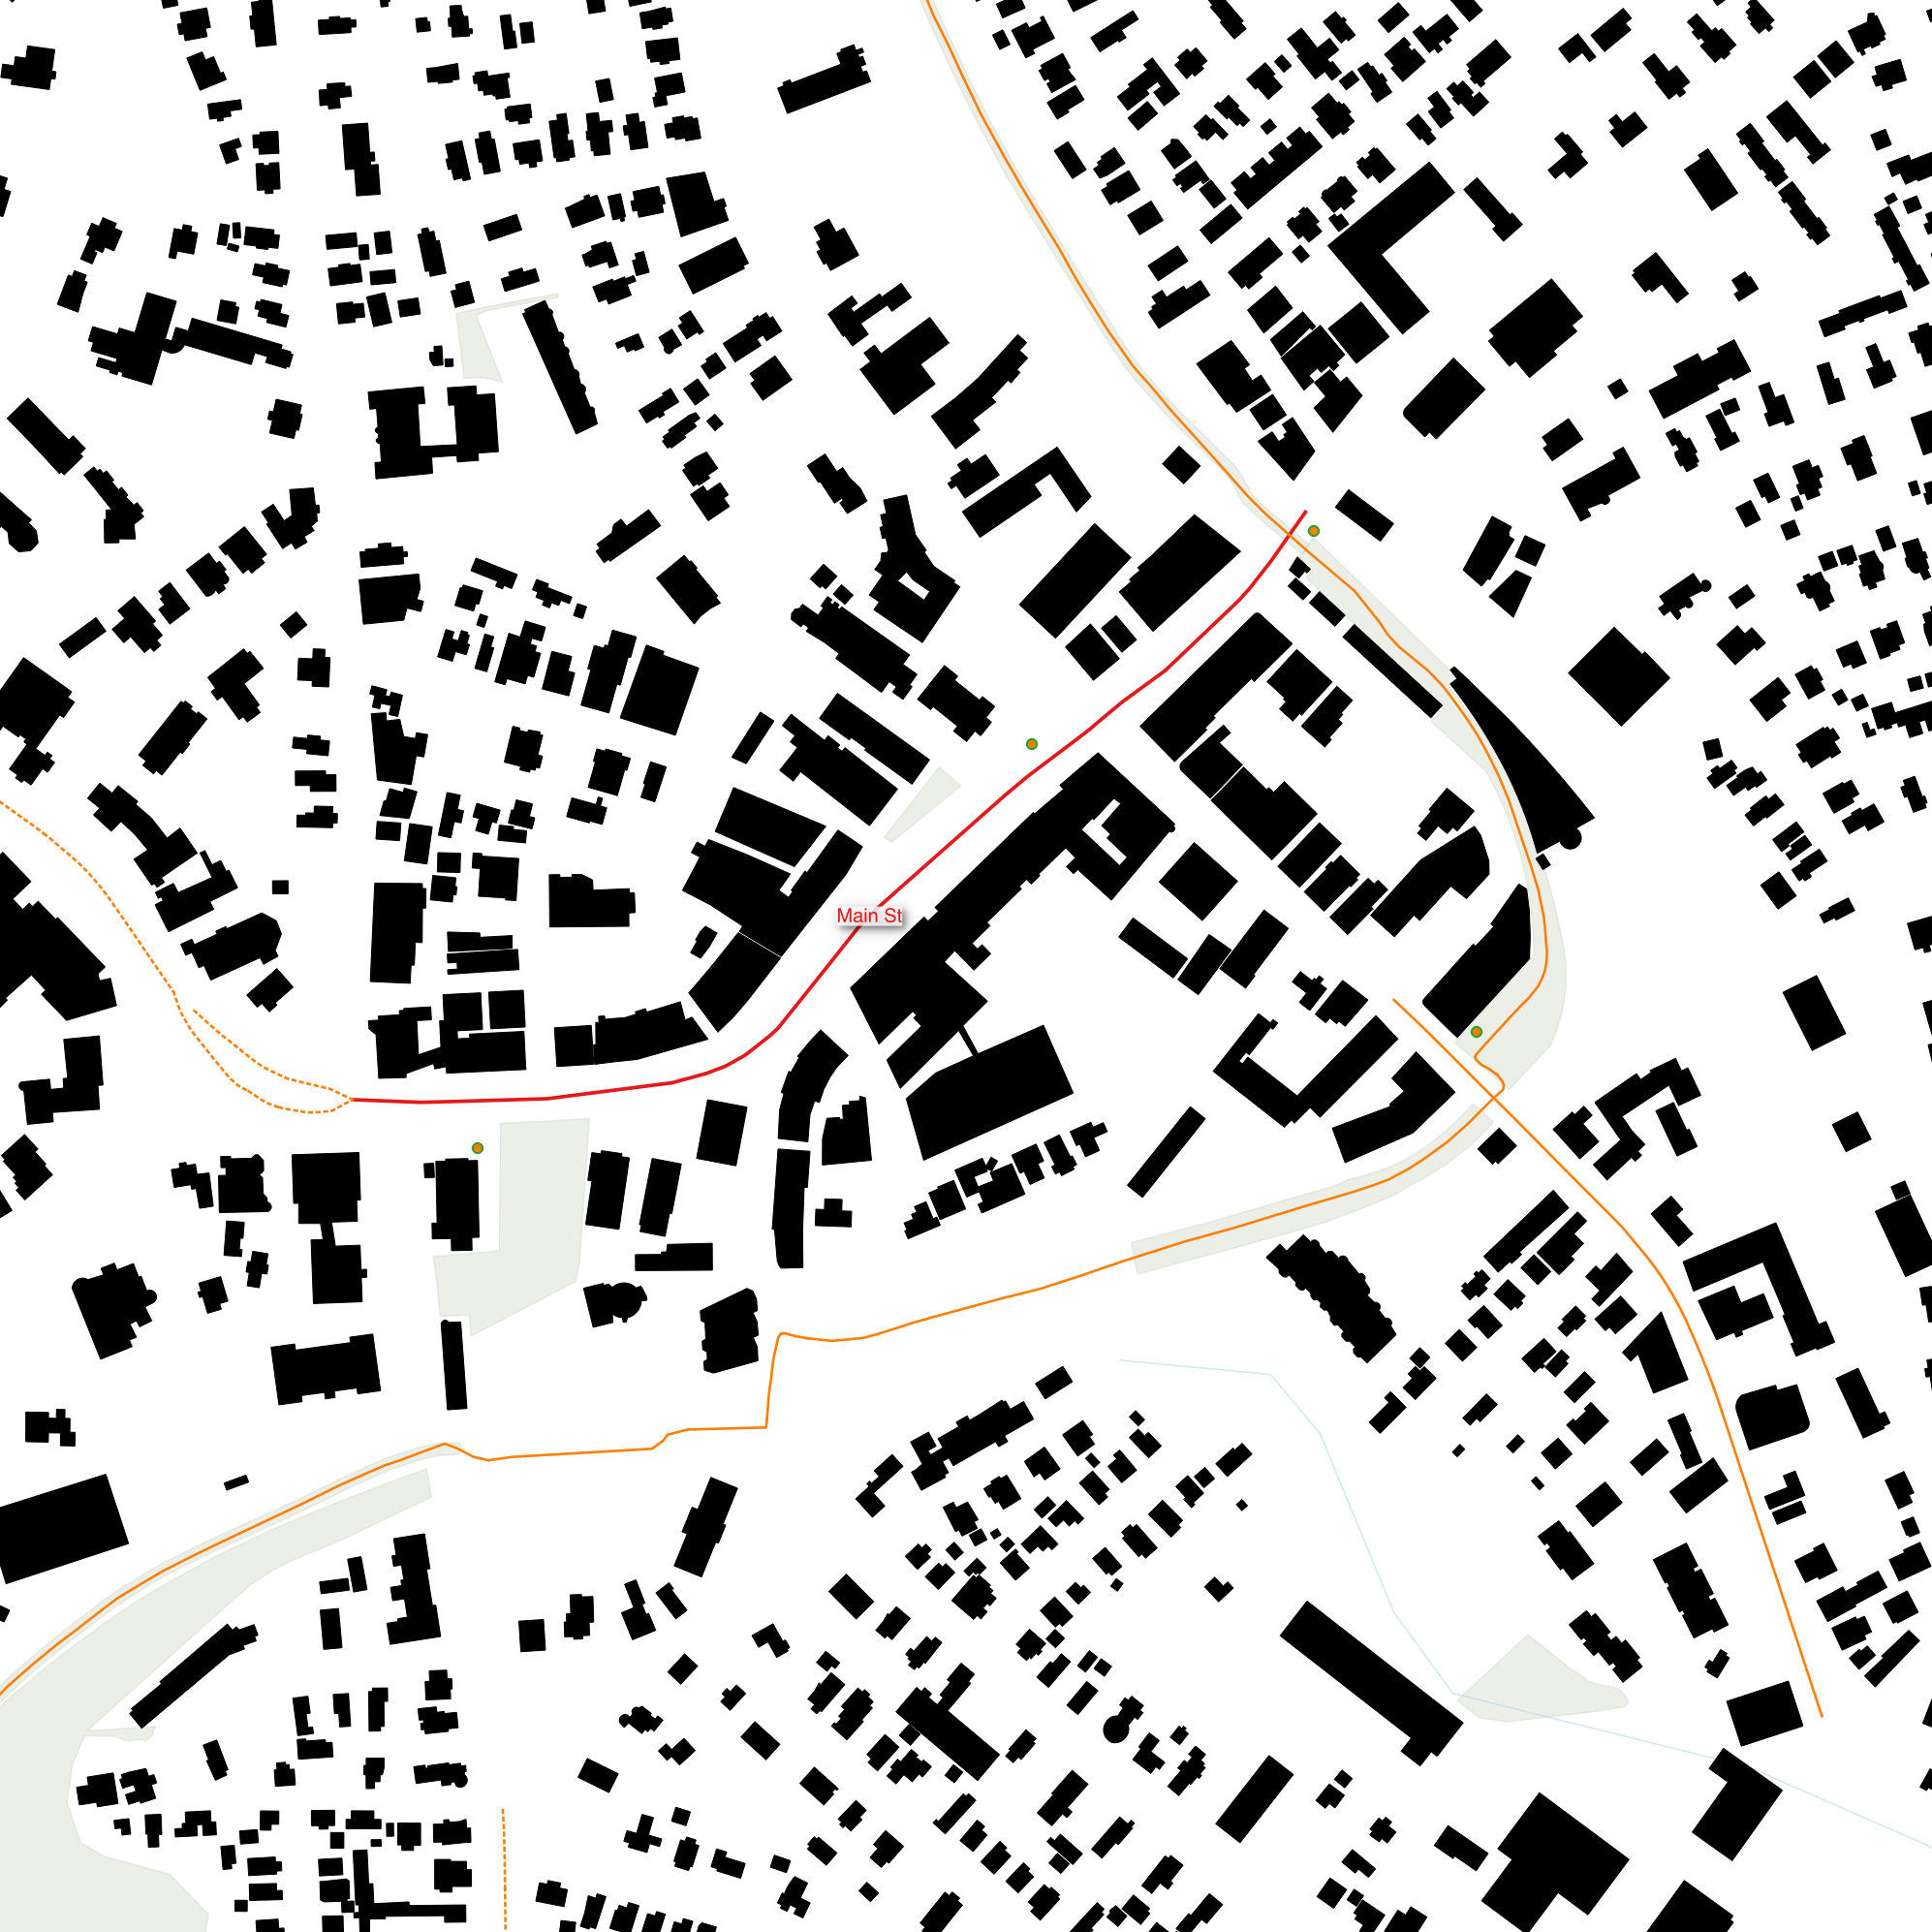
Main Street. Will people bike there? An addendum.
Python, SQL, QGIS, and ValleyBike trip data reveal the average cyclist’s range—or at least a useful estimate.
Main Street. Will people bike there?
Python, SQL, QGIS, and ValleyBike trip data reveal the average cyclist’s range.
NYC bike share: Tourist versus native (round 2)
Investigating New York’s Citi Bike system data with SQL, Python, and QGIS.
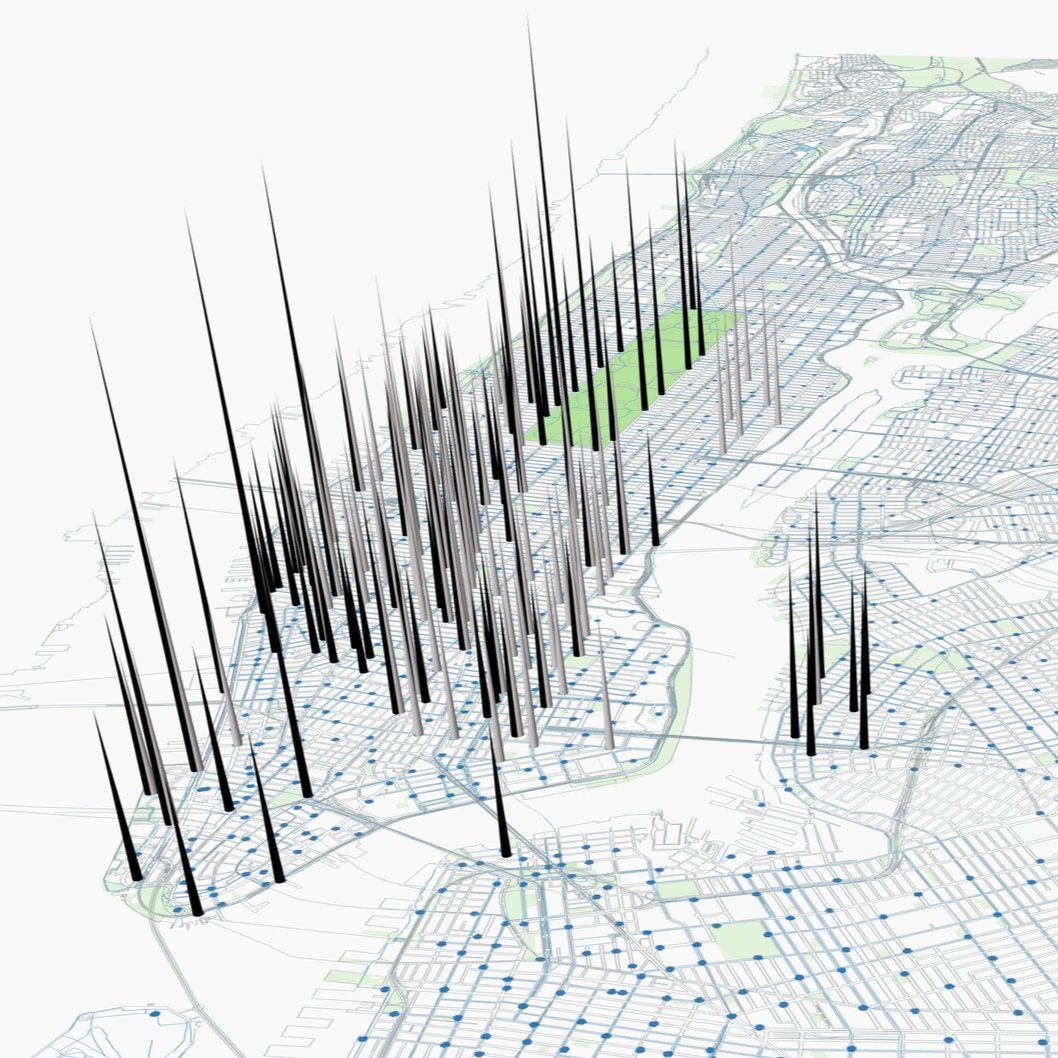
NYC bike share: Tourist versus native (round 1)
Investigating New York’s Citi Bike system data with SQL, Python, and QGIS.

Fortress America: How isolated are U.S. embassies in Africa?
ChatGPT’s Code Interpreter, Python, and QGIS help confirm a personal observation.

Do EV owners drive their cars?
Using Python and GIS to visually explore the Massachusetts Vehicle Census.

Chess. When do I play my best?
Using Python to determine my online chess win-draw-loss record for each hour of the day. And yours.

Finding EV fast chargers
A GIS and Python project exploring the location of Level 3 (aka DC fast) electric vehicle chargers in North America, with a Massachusetts deep dive.